
In the past few weeks, Entrance’s software consultants have been focusing on SQL server tuning as part of an internal lunch and learn series.
Last week we covered how maintenance plans can be used to improve database performance. This week, I wanted to share some interesting tools that can help us identify SQL commands or queries that are causing server performance problems, like excessive memory/CPU usage or disk reads.
Performance Monitor
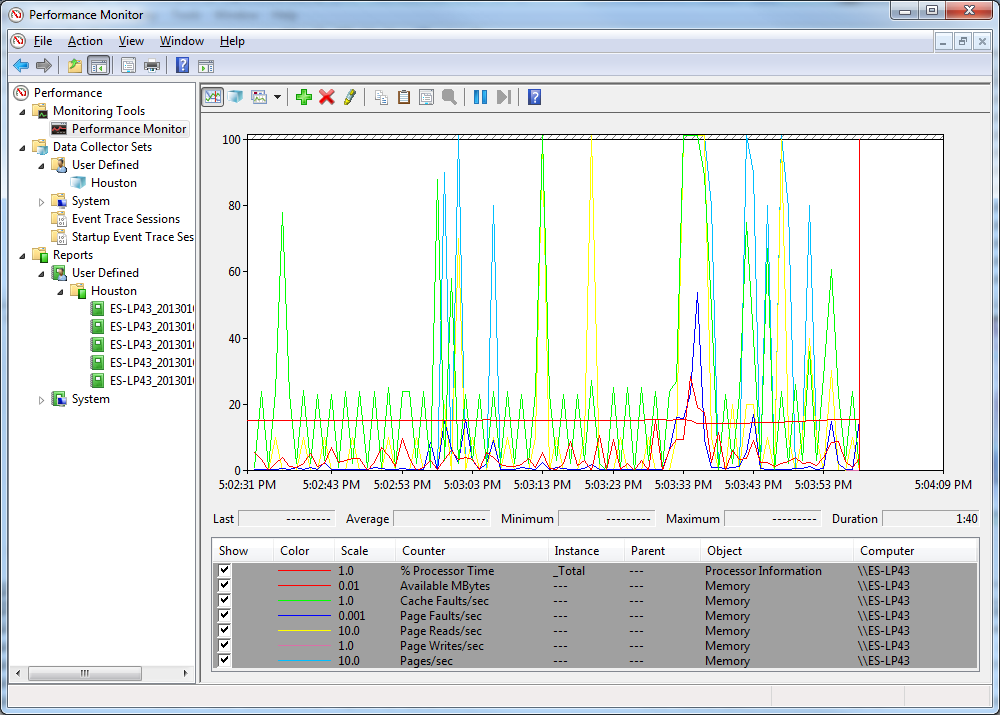
The first of these tools is Performance Monitor. It allows you to view real-time and logged data about the performance of your computer (or a remote computer) along many different metrics.
These are metrics specific to your computer, such as Disk I/O, Network Utilization, and Processor Time, and also in our case, metrics specific to SQL Server, such as Number of Deadlocks, SQL User Connection Count, or Buffer Hit Ratio.
Below is an example of the data that Performance Monitor collects, including SQL Server specific Counters, like processor time, context switches/second, and number of deadlocks.
Profiler
Another tool that can be used in conjunction with Performance Monitor is SQL Server Profiler, which comes bundled with your SQL Server install.
Profiler allows you to monitor queries that are run against a database server (or Analysis Service) and view it in real time or to store that information to trace files or tables for later review/use.
When you set up Profiler, you tell it to log events like Stored Procedures, in addition to optional events like errors and warnings, deadlocks, and stored procedures.
The beauty of this tool is that Performance Monitor and Profiler log a lot of the same data. Picking the right counters from Perfmon and the right events from Profiler allows you to pair up the data together into graphs that provide even more visibility into your data.
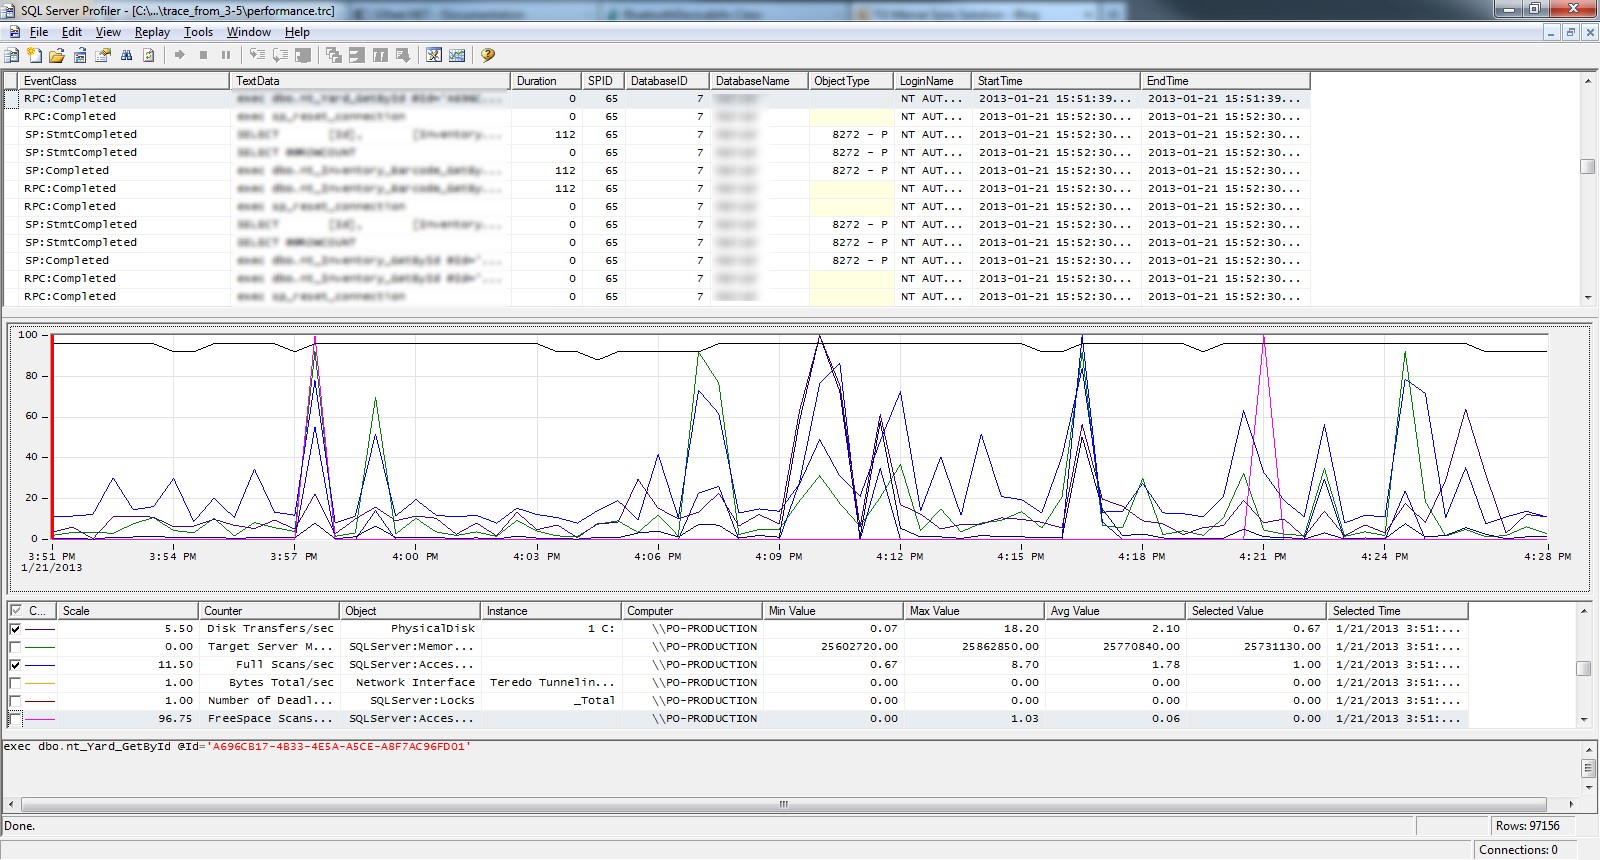
The image to the left is an example of what this pairing might look like. You can then scroll through this and select a time period to see what queries ran when and see the direct impact on performance they had. This is a great tool, because it removes a lot of the guesswork associated with fixing SQL Server performance problems.
For more on SQL Server tuning, check out our software consultant’s best practices for using indexes to improve search.